Navigating our Entry to the Field
The central point of this introductory segment is to understand how this network has been used as a point of departure to the Paleo Controversy. And at the same time provide tools that allows you to follow the path or take another.
Preliminary explorations of the Google-Slave-Network
|
Community Detection and Spatialization
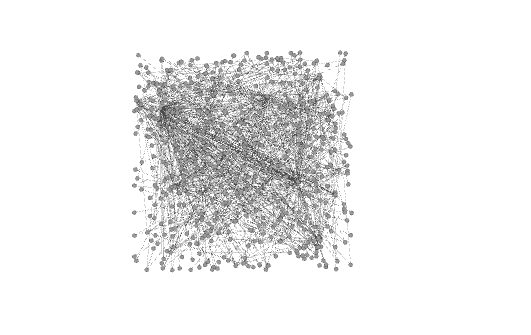
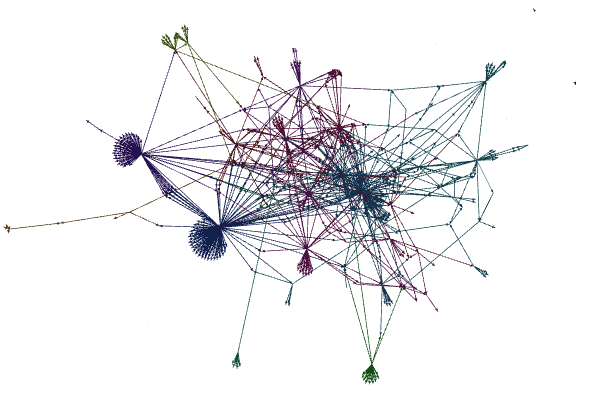
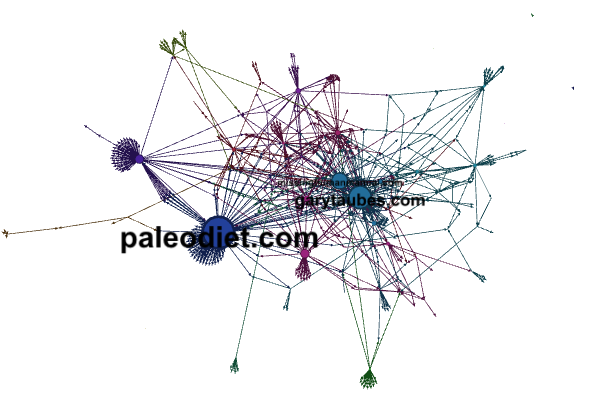
What to look for is an obvious question in the random chaos to the left. We could start systematically from the corner, looking at all relations, looking at all sites, one by one. Basically we did this while gathering the network of sites. We just started from the 'left corner' that google provided us. However a very widely used heuristic is the community detection and spatialization that groups of actors which have similar link structures. Basically community detection optimizes that actors in the groupings that have similar connections, penalizing out of community links. In a similar way the spatialization simulates attraction and repulsion between actors, where a link between two creates an attraction, and lack becomes repulsion. This means that actors with similar connections are drawn towards each other. This also means that central actors are representing actors with a link structures to and from many in this community sense, different sites with different link structures, placing the others around this center, repulsed by each other. This analytical move makes us assume that the same colors and the same areas involve similar actors and we can now choose one from each, or just start with the biggest or the smallest group, or the one furthest away from the center or the closest. This strategy can provide means of representing and covering a broader field, by ignored some sites under the assumption that we have already looked at another similar site. Our investigation has undoubtedly been guided by these visual clusters, pointing us both towards peripheral corners, and central positions. Below we introduce other useful analytics and illustrate what actors will have a privileged position in our field of vision. A very important thing to notice is that the spatialization and community detection is fully depended on our sample. Any variations in the sample can potentially alter the positions radically, and tip the community optimizations to very different distribution of groups. This will be explored under the heading Investigating Our Googles. |
|
Size Matters
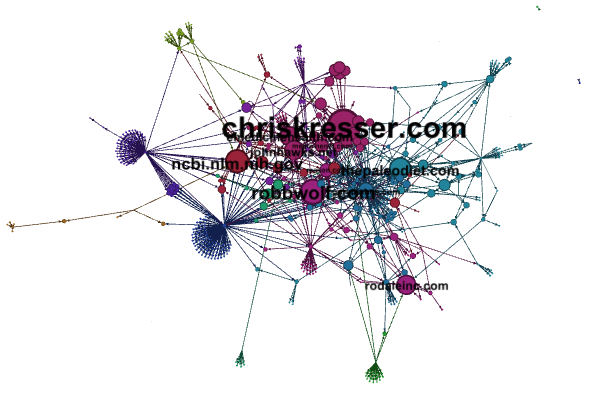
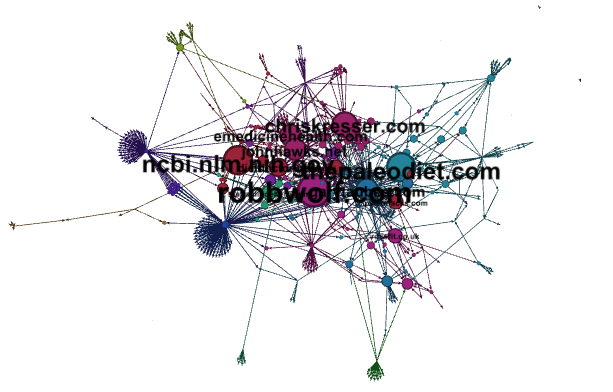
Using the idea of in-links (other sites linking to the site) as importance and authority we see how the size of the node suddenly communicates that Chris Kresser and Robb Wolf are important figures, ThePaleoDiet.com representing a professor named Dr. Loren Cordain. This idea has also been very important for us, and if you look under the heading Concerned Experts you see that these figures have been chosen for a more careful investigation. The same idea that unimportant nodes could be ruled out as noise, made us pick out a subset of the Top50 sites in our entry network, defined by in-degree. Under the heading Investigating our Googles you shall get a chance to explore the results of the so-called Lippmanian device, using wordcounts to get clues on where to look for different subjects, and which subjects are most prevailing at different sites. First we shall look at other heuristics. |
Where are the Bridges between actors in the Controversy?
In the next segment we shall explain how different analytics might help us locate actors engaged in broader discussions with many different actors, and diagnose to which extent different publics are small pockets. Here we explain and visualize different network analytics, to see which actors they point to.
Three analytics identifying bridges
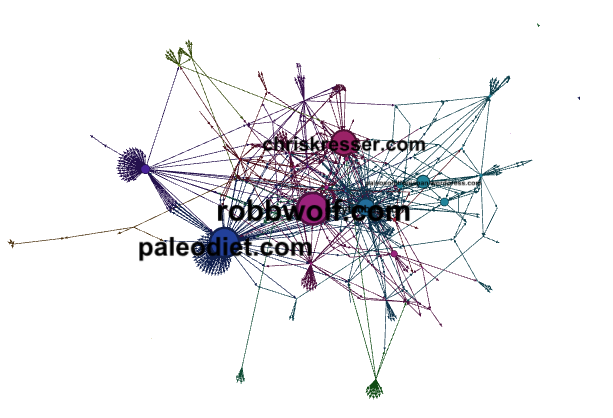
Betweeness Centrality
Robb Wolf, Paleodiet.com and Chris Kresser are highlighed again. |
Out of Community Links
We see paleodiet.com again and a new interesting face Gary Taubes. See Concerned Experts. |
Outside of Community In-Links Here is a much more blurry picture. A mixture of high in-links and diverse in-links seems to create a more egalitarian distribution. |
How do these analytics identify broadly engaged actors?
Betweeness Centrality
Betweeness centrality uses a notion of Path Length, measured by number of jumps to get from one site to another using hyperlinks. Betweeness centrality generalizes this notion, and calculates all shortest paths from every node in the network to every other node in the network. Each actor then gets weighted according to how many times it is on a 'shortest path'. We interpret this as bridges. However as mentioned in the introduction we are aware that our hyperlink is a biased sample lacking and potentially overlooking many shorter paths. They do tell us that the actors were central discoveries in our mapping process, given that they open up paths to many actors in the network. If we should evaluate Googles logic, we would be concerned that we got actors with high betweenness centrality.
Out of Community Links
Combining the knowledge of patterns, and clustering of different link structures, common links between sites in the network, with the idea of bridges, we have constructed a measure, counting the out-links of a node that leave the 'Community'. Again the idea is that it will lead us towards actors engaging in broader debate, more unconventional links.
Outside of Community Inlinks
You might link out to lots of different sites, but being central in a controversy might also mean that other sites care about you. To nuance the idea of authority and importance, we combine community structure with in-links. Here we count only links that are unconventional, outside the community of sites that most of your interactions (outlinks and inlinks) are from.
Your chance to Interact with the analytics
Introduction to the bar chart
The above interactional graph let's you explore the four heuristic parameters in our Entry Point. On the x-axis you have the different sites, and each bar represents the size of the parameter. In the left corner you can choose which of the the different parameters should constitute the y-axis. This lets you explore how each analytics represents each site, without the distraction of network spatialization and colors, that in many ways tend to relativize the size of the node to it's immediate neighborhood, and to it's colors. Another cool feature is that it allows you to directly compare how each analytic emphasize each site, by clicking on the 'Values'-button under the heading of 'Sort'. Everytime you press this, the data will align the sites in descending order according to the chosen analytic, and when choosing the other analytic the order is kept which allows you to see the differences. Pressing the 'data order'-button will set them in the random order again. This can be an advantage because of the relatively small width of the each bar and the lack of color-codes of each site, that blurs out the distinction between similar sized bars.
